

The vertices behind rows and columns
This input has three rows and three columns, corresponding to vertices 1, 2, and 3. A 1 in row 1, column 2 means that vertices 1 and 2 are connected. A 0 means there is no edge for that pair.
The main diagonal pairs each vertex with itself. Its entries are all 0 in this example, so there are no self-loops.
Why six ones give three edges
For an undirected graph, row 1, column 2 and row 2, column 1 describe the same edge. This example has six ones outside the diagonal. Grouping them into symmetric pairs gives three edges.
Those edges are 1–2, 1–3, and 2–3, forming a triangle. In a directed graph, entries in opposite directions describe separate edges.
Compare the table with the diagram
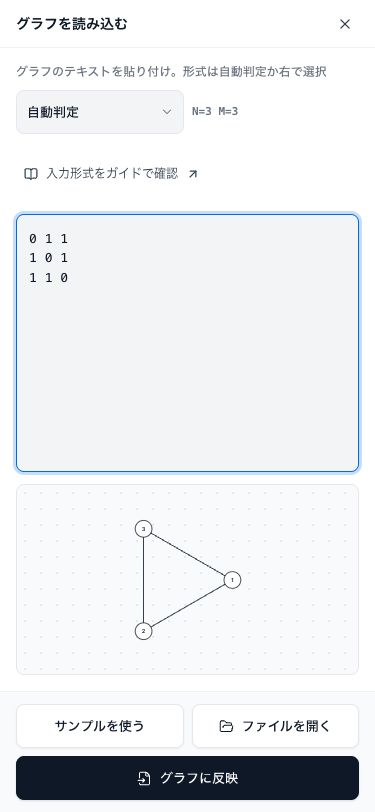
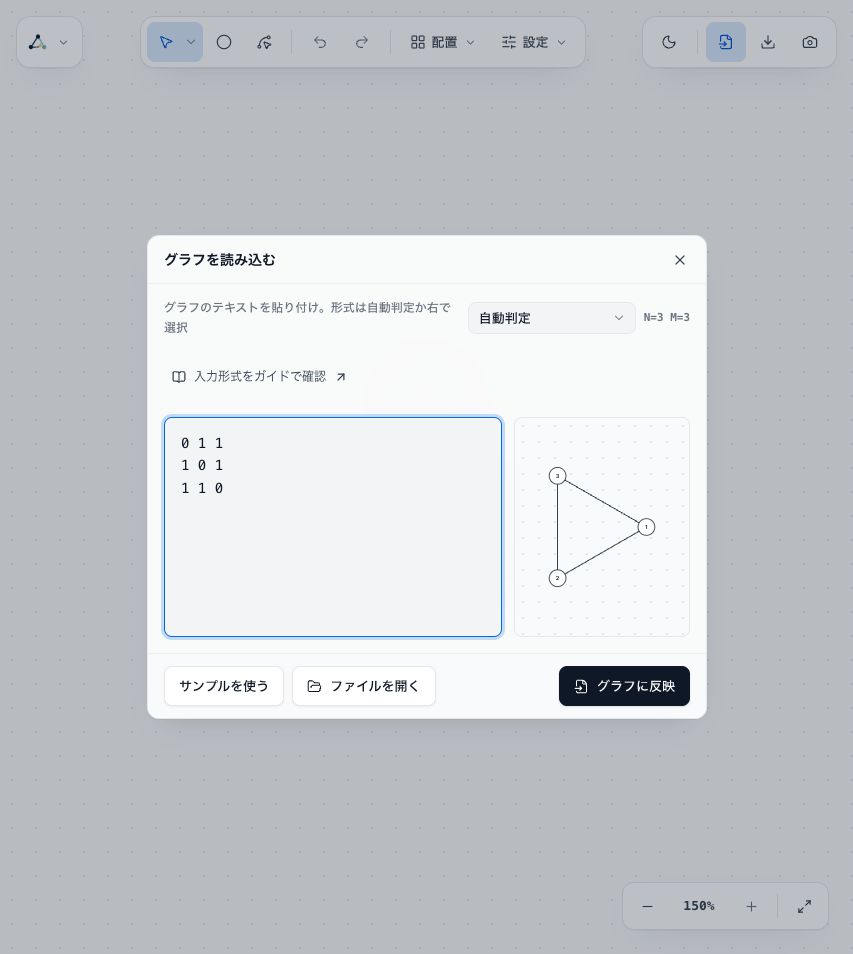
Choose adjacency matrix as the format and Undirected and 1-indexed in Settings. Check the three-vertex, three-edge preview, then match the two ones in each row to the two edges meeting that vertex.
Positions depend on the layout. Check the connected vertex pairs rather than the triangle's orientation or the order of vertices on the page.
Compare the input and diagram
Input to copy
0 1 1
1 0 1
1 1 0
Graph diagram